Risk Aggregation
Bring available vulnerability, configuration and control-gap records into scenario views. Review input coverage, scoring assumptions and uncertainty before using a portfolio score to support a decision.
Model how assets, vulnerabilities, suppliers and control gaps interact so teams can act on likely impact, not isolated findings.

Individual risk scores do not show how weaknesses may combine across services and suppliers. Without a shared scenario view, teams struggle to compare exposure and plan a response.
Bring available vulnerability, configuration and control-gap records into scenario views. Review input coverage, scoring assumptions and uncertainty before using a portfolio score to support a decision.
Model exposure impact if a vulnerability remains unpatched, a supplier is breached, or a framework deadline is missed. Board-ready risk impact summaries.
Explore possible paths using connected vulnerability, configuration and permission records. Validate missing topology or permissions before ranking remediation options.
Use documented scenarios and control records to prepare for a conversation with your chosen insurer, broker or underwriter. You decide what to share; the recipient makes its own underwriting and pricing decisions.
Explore the asset mind map view within the Fig platform.
A tailored walkthrough lets you review the relevant workflows, supported connections and reporting before deciding whether Fig is right for your team.
See it in a demo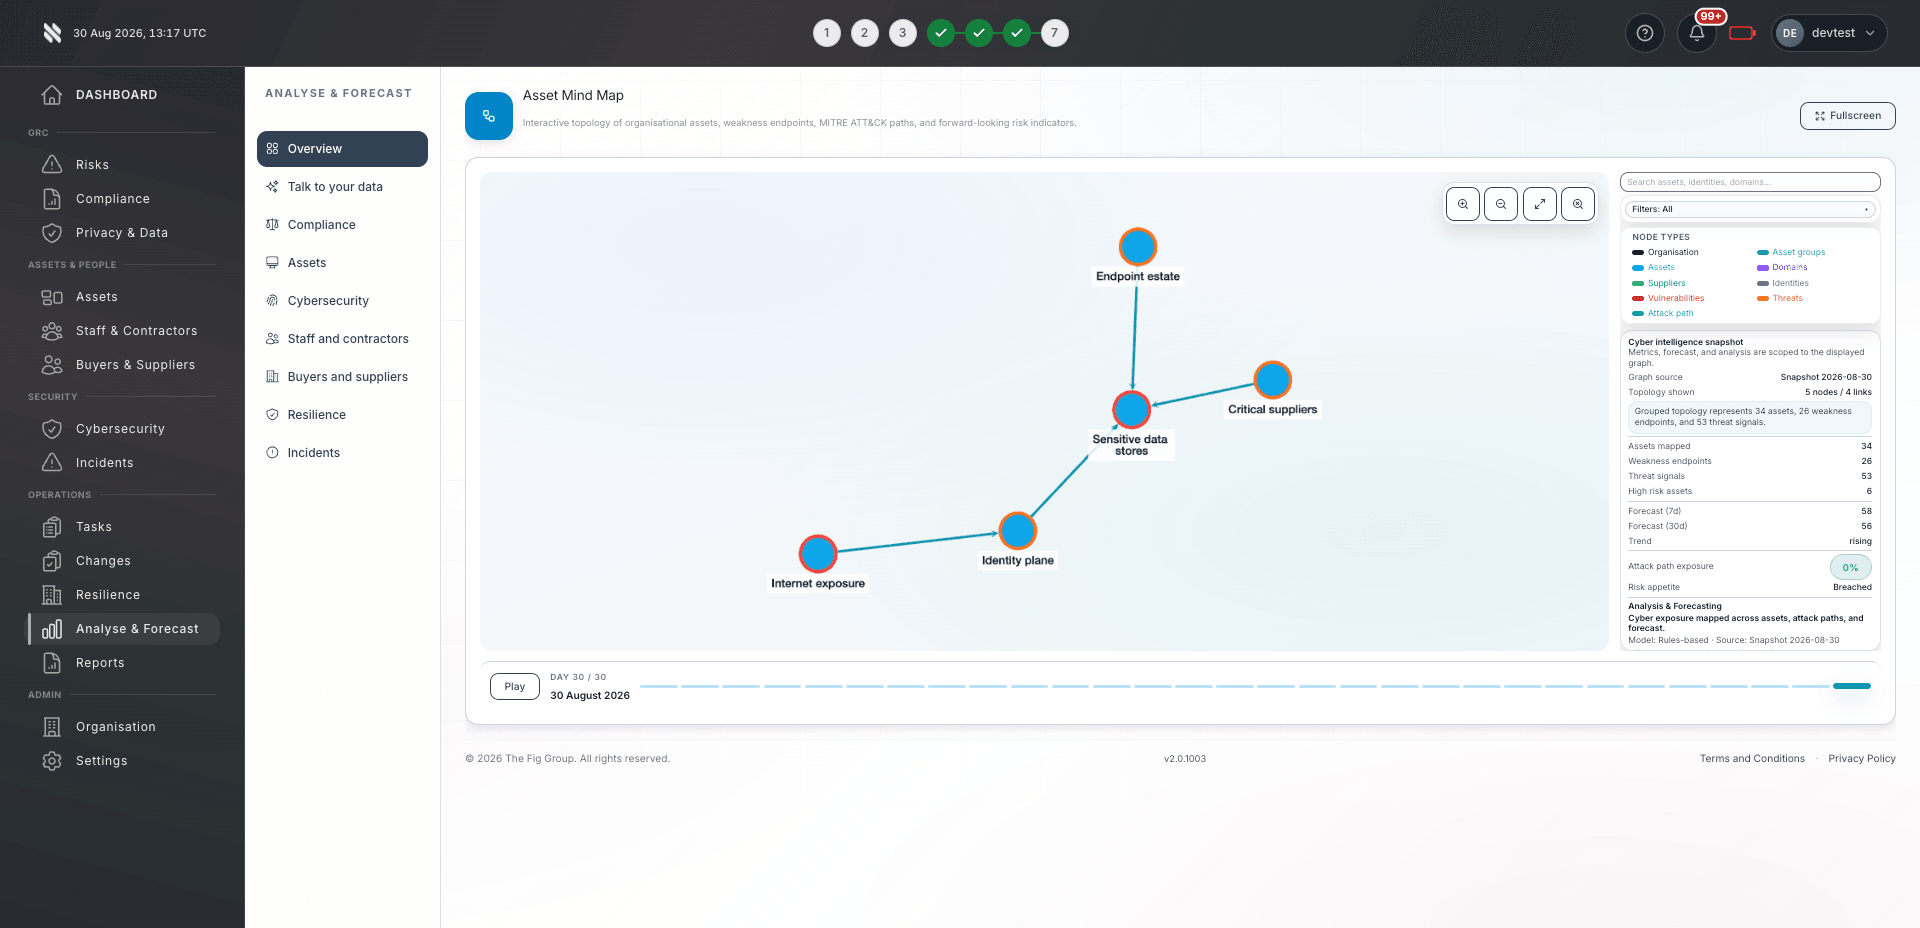
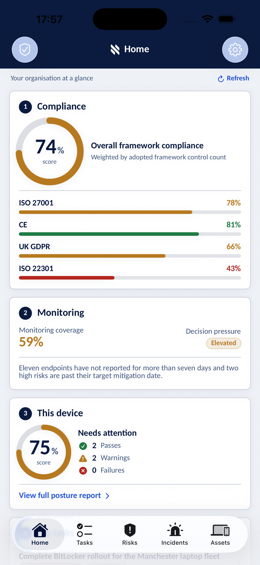
Bring delivery, oversight and assurance together without losing sight of who owns the next action.

Portfolio-level risk aggregation across all clients. Scenario models and attack path analysis strengthen your managed security services pitch.
Explore Fig for MSPs
Board-ready risk dashboards showing exposure trends. What-if scenarios inform budget allocation and strategic risk decisions.
Explore Fig for organisations
Risk assessment models and remediation prioritisation evidence for enterprise risk management and governance audits.
Discuss your requirementsStart with the outcomes you need. We will discuss scope, delivery and commercial terms with you before you commit.
Discuss your current approach to exposure modelling, the teams involved and the requirements you need to meet.
See the relevant features in a tailored demonstration. Confirm integration coverage, responsibilities and any configuration needed.
Review the proposed scope and pricing. Set implementation priorities, ownership and review points around your organisation or client portfolio.
Platform functionality and automation depend on the agreed scope, configuration and connected systems. Software supports your compliance programme; it does not replace an independent assessment or guarantee certification.
Need to discuss a specific requirement or client scenario?
Speak to FigNo. Fig Group connects the available asset, vulnerability and control data to scenario analysis. A score is an estimate based on recorded inputs and assumptions, not a measured probability of breach or a forecast of insured loss.
Yes. You can model the impact of a supplier breach by running scenarios where that supplier's access rights are compromised, then tracing downstream exposure to your critical systems.
Fig Group analyses connected vulnerability, topology, permission and configuration records for possible chains of weaknesses. Review source coverage and assumptions with your security team before acting on a ranking.
Yes. Teams can use scenario outputs in budget discussions, with the source inputs, financial assumptions and uncertainty made clear. Validate any monetary estimate against your own business data before presenting it as an expected loss.
Scores can be recalculated when connected inputs change. Their freshness depends on each source and its last successful update; review stale or missing inputs before relying on a scenario.
Tell us what you would like to achieve. We will arrange a relevant conversation about the platform, your requirements and the right next step.
Continue exploring the protect capabilities, or return to the full platform overview.